
MAP math scores by grade
| Grade | Fall | Winter | Spring |
|---|---|---|---|
| K | 140 | 146 | 153 |
| 1 | 160 | 170 | 176 |
| 2 | 176 | 184 | 190 |
| 3 | 189 | 195 | 200 |
| 4 | 200 | 205 | 209 |
| 5 | 209 | 214 | 217 |
| 6 | 215 | 219 | 221 |
| 7 | 221 | 223 | 226 |
| 8 | 226 | 228 | 230 |
| 9 | 229 | 231 | 232 |
| 10 | 231 | 233 | 234 |
| 11 | 234 | 235 | 236 |
| 12 | 235 | 236 | 237 |
MAP reading scores by grade
| Grade | Fall | Winter | Spring |
|---|---|---|---|
| K | 137 | 146 | 153 |
| 1 | 156 | 166 | 171 |
| 2 | 172 | 181 | 186 |
| 3 | 187 | 193 | 196 |
| 4 | 197 | 201 | 204 |
| 5 | 205 | 208 | 209 |
| 6 | 209 | 212 | 213 |
| 7 | 213 | 215 | 216 |
| 8 | 216 | 218 | 218 |
| 9 | 218 | 219 | 220 |
| 10 | 220 | 221 | 222 |
| 11 | 223 | 223 | 224 |
| 12 | 223 | 224 | 224 |
How to read these numbers
- The average is the 50th percentile. A score at the number in the chart means your child scored about the same as the typical student in that grade and season.
- Scores rise during the year. That's why fall, winter, and spring have different averages. Compare your child's score to the same season.
- About 10 RIT points is a big gap. In most grades, one standard deviation is roughly 12–19 RIT points, so a score 10 points above average is well above the typical student.
- Growth slows in older grades. Younger students often gain 10+ points a year; high schoolers may gain only a few. Slower growth later is normal.
What is a good MAP score?
A "good" score depends on grade and season. Scores near the chart average are on track. NWEA describes percentiles in bands: below 21st is Low, 21st–40th Low Average, 41st–60th Average, 61st–80th High Average, and above 80th High. Just as important as the score is growth — whether your child is gaining RIT points from one term to the next.
New to RIT scores? Start with what a RIT score means.
Find your child's percentile automatically
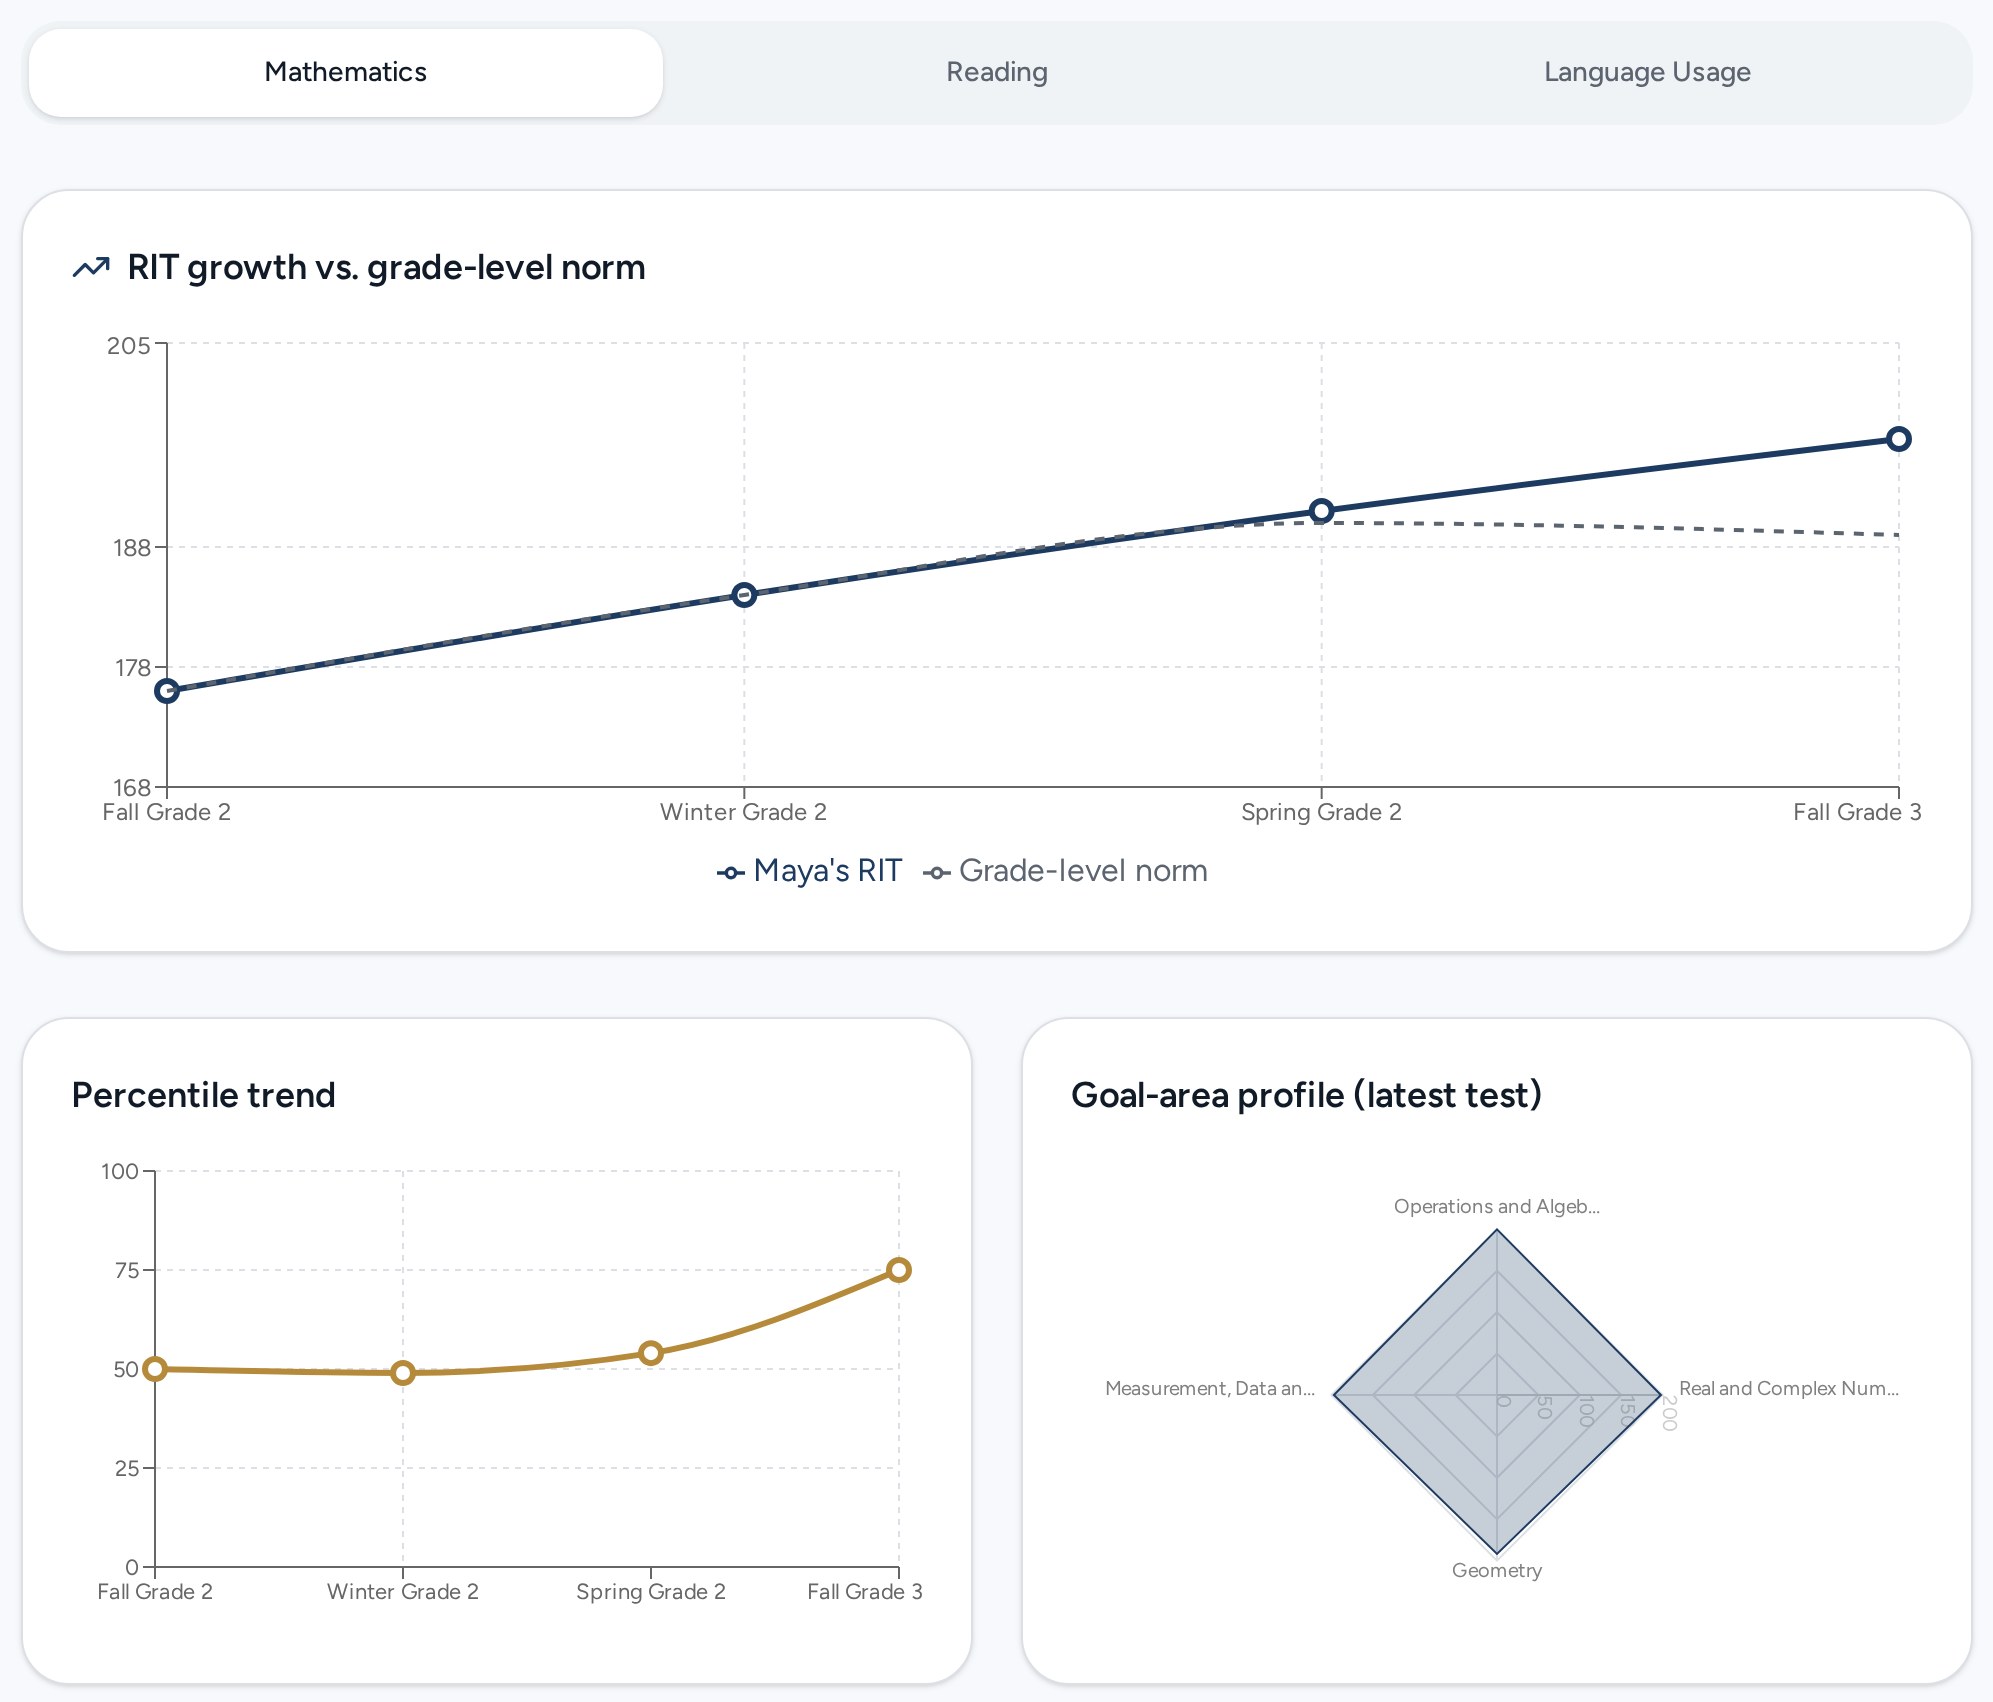
Mighty Minds uses these same norms. After each practice test, parents get the RIT score, percentile, and a plain-language summary — and you can enter your child's past school scores so practice starts at the right level.
Source: NWEA 2020 MAP Growth achievement status norms. Values rounded to the nearest RIT point.